How to calculate the number of connections in a Social Network.
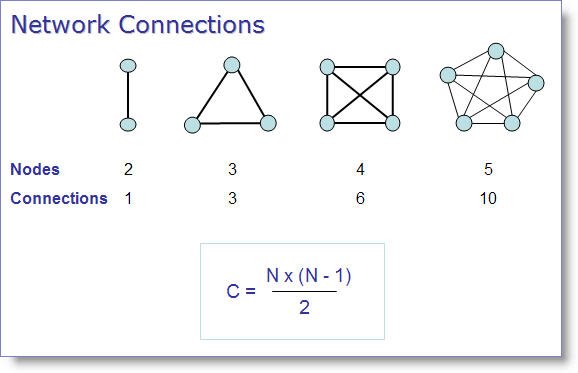
A social network is presented graphically as nodes (points) and connecting lines. The nodes represent people and the lines represent the existence (or absence) of a relationship between them. Let's assume for a moment that the relationships are of equal value in both directions - that is, node A interacts with node B at the same level of intensity as B interacts with A (obviously this will not always be the case, but let's accept this simplification for now). In this case the total number of possible connections in a fully saturated network is given by the formula shown.
For example: with five nodes there are 5x4 = 20 possible interactions, therefore 20/2 = 10 connections.
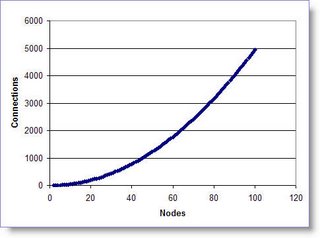
Rather obviously, and in agreement with common experience, the possible number of connections rises much more rapidly than the rate of increase in the number of nodes. As the community you live in gets larger the more difficult it becomes to objectively evaluate the relationships between othere members. The graph gives a sense of the scale of the problem - for a small company of 100 people there are almost 5,000 possible social connections. It seems clearly impossible for an individual employee to have any objective sense of how information is REALLY flowing through this social network (without some appropriate analysis tools).
How to calculate Network Density.
An important metric for social networks in the real world is their density - how well connected are the nodes in a real network relative to the theoretical number of connections possible. This measurement is intended to give a sense of how well communication pathways in the network are capable of getting information out to the network's participants. The calculation is straightforward - known connections divided by maximum possible connections. (an ideal, fully connected network would have a density of 1.00)
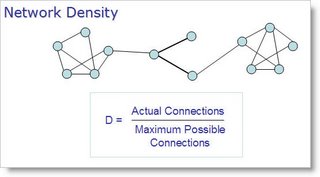
For example: the network in the graphic has 13 nodes and 17 known social connections. But with 13 nodes there are 78 possible connections. This means the density of the network is 17/78 = 0.22 (in a real-world network this calculation is usually completed after discounting any unconnected nodes).
Common experience confirms that the density of networks goes down as the size of the group increases. Research suggests that above a few hundred nodes the maximum density will never be greater than 0.5. Network density is intended only as a rough guide to connectedness it is not a hard-and-fast indicator of group performance - it needs to be interpreted intelligently.
However, these initially simple ideas begin to open doorways to interesting questions - what inferences can be drawn from the structural shape of social networks and what would be an optimal size for a functional team/community?
My next post will discuss metrics associated with optimal community sizes.

No comments:
Post a Comment